Traffic Overview
Monitor page views, unique visitors, and session data.
Access analytics
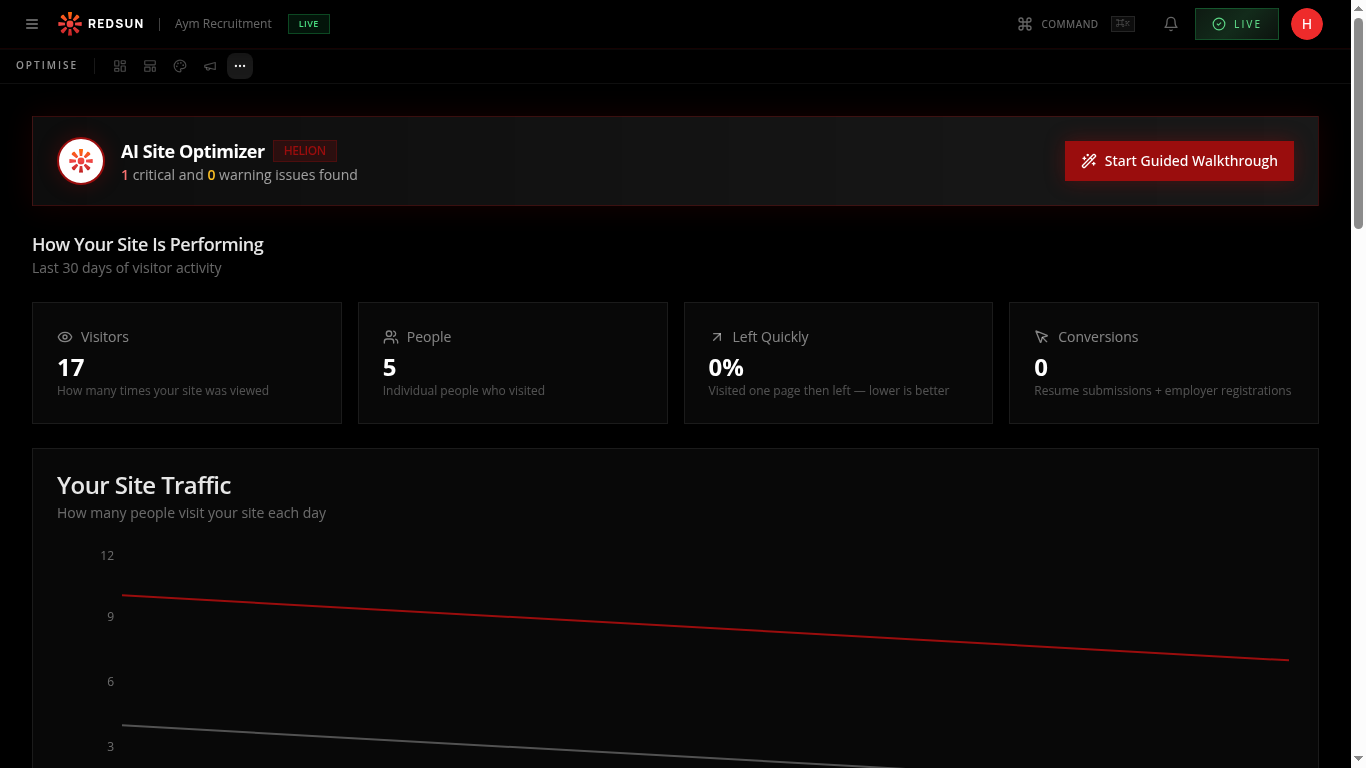
Click the 'Optimise' tab in the top navigation (chart icon). The overview shows the AI Site Optimizer banner with critical/warning counts, then headline metrics: Visitors, People, Left Quickly (bounce rate), and Conversions.
Review traffic trends
Below the metrics, the 'Your Site Traffic' chart shows daily page views and visitor trends over the last 30 days. Spot patterns like weekly cycles or campaign-driven spikes.
The red line shows page views and the grey line shows unique visitors — a growing gap means returning visitors are engaging more.
Conversion journeys
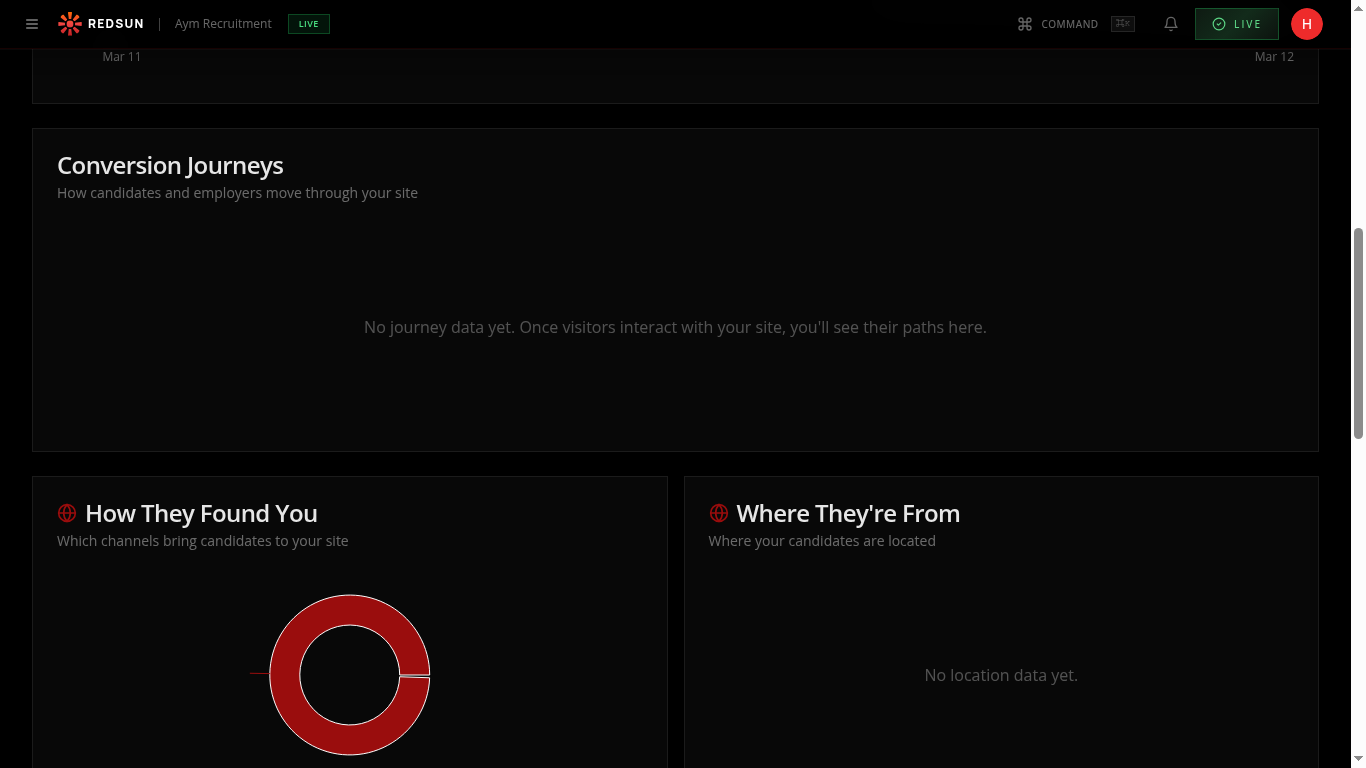
Scroll down to see the 'Conversion Journeys' section showing how candidates and employers move through your site funnel.
Traffic sources
The 'How They Found You' donut chart breaks down traffic by channel. 'Where They're From' shows geographic distribution of your visitors.
Guide complete
You've covered all 4 steps. Check out the related guides below.
Still need help?
Our support team is here to assist you.